Difference between revisions of "Layer Symbology"
(→Polygon symbology) |
(→Polygon symbology) |
||
| Line 34: | Line 34: | ||
==Polygon symbology== | ==Polygon symbology== | ||
| − | + | {| border="0" style="text-align: left;" | |
| + | |style="width: 50%;"|<b>Polygon Symbology:</b> | ||
| + | You can '''Add''' or '''Remove''' a rule to the table. The '''Fill''' and '''Line''' of polygons can be edited, and '''Filters''' can be applied to these rules using the standard operators (<,>,=<,>=,=). Complete changes by clicking '''Apply'''. | ||
| − | + | |style="padding:10px"|[[image:new_polygon_symbologoy_70.png|center|style="padding:50px;"|Raster Symbology]] | |
| + | |- | ||
| + | |} | ||
==Symbology Import/Export== | ==Symbology Import/Export== | ||
Revision as of 22:41, 7 August 2018
The Symbology functionality (from the My Layers window) is based on styles supported by GeoServer. Please see GeoServer User manual for more information.
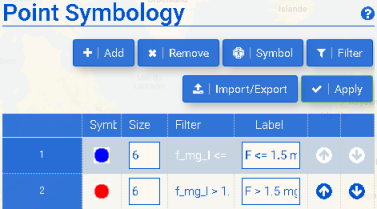
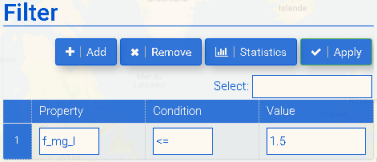
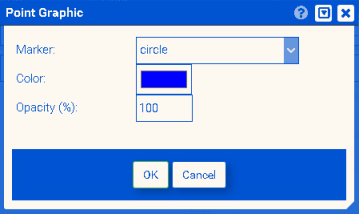
Point symbology
Raster symbology
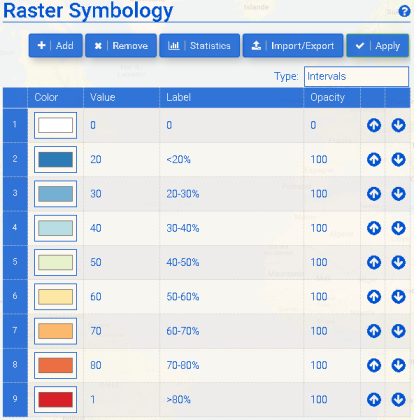
| Raster Symbology:
You can Add or Remove a rule to the table. To decide how to set up appropriate rules, it is often helpful to first look at the Statistics. You can then choose the color scheme representation under Type. The default Type is interpolation (ramp), with the others being Intervals and Values. For help in selecting the appropriate type, please refer to ColorMap type. If Intervals is selected, the first rule in the table should use the no data value of the coverage. Statistics displays the cumulative distribution of the values of a raster dataset as well as its mean, median and IQR (interquartile range), which indicates the middle 50% of the dataset. Click Apply to use the new rules. |
Polygon symbology
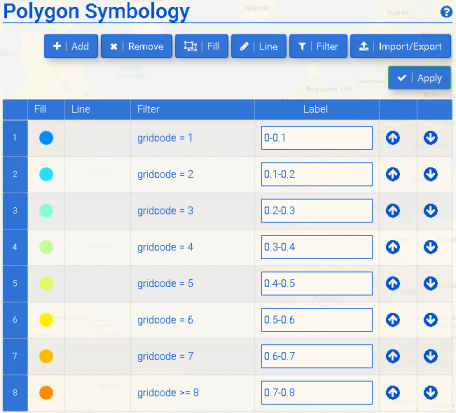
| Polygon Symbology:
You can Add or Remove a rule to the table. The Fill and Line of polygons can be edited, and Filters can be applied to these rules using the standard operators (<,>,=<,>=,=). Complete changes by clicking Apply. |
