Difference between revisions of "File:Figure 7.11.jpg"
From GapWiki
(Fig. 7.11 Fluoride uptake as a function from field tests in Ethiopia and Kenya. Shaded areas show ranges for BC and CP obtained from laboratory tests done at NDC (Kenya) and Eawag (Switzerland) (Johnson et al., 2011)) |
(Gap uploaded a new version of "File:Figure 7.11.jpg") |
(No difference)
| |
Latest revision as of 14:04, 6 May 2016
Fig. 7.11 Fluoride uptake as a function from field tests in Ethiopia and Kenya. Shaded areas show ranges for BC and CP obtained from laboratory tests done at NDC (Kenya) and Eawag (Switzerland) (Johnson et al., 2011)
File history
Click on a date/time to view the file as it appeared at that time.
| Date/Time | Thumbnail | Dimensions | User | Comment | |
|---|---|---|---|---|---|
| current | 14:04, 6 May 2016 | 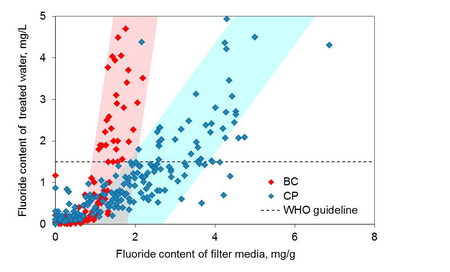 | 450 × 272 (75 KB) | Gap (talk | contribs) | |
| 14:23, 15 November 2026 | No thumbnail | (75 KB) | Gap (talk | contribs) | Fig. 7.11 Fluoride uptake as a function from field tests in Ethiopia and Kenya. Shaded areas show ranges for BC and CP obtained from laboratory tests done at NDC (Kenya) and Eawag (Switzerland) (Johnson et al., 2011) |
- You cannot overwrite this file.
File usage
The following page links to this file:


