File:Figure 9.3.jpg
From GapWiki
No higher resolution available.
Figure_9.3.jpg (439 × 292 pixels, file size: 82 KB, MIME type: image/jpeg)
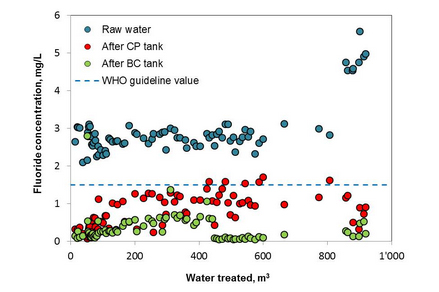
Fig. 9.3 Results of fluoride monitoring from 20.05.2010 to 28.02.2013 in the Nakuru Technique filter. CP: contact precipitation (“Nakuru Technique”), BC: bone char. At around 800 m3, the concentrations of fluoride and salts in the raw water rises.
File history
Click on a date/time to view the file as it appeared at that time.
| Date/Time | Thumbnail | Dimensions | User | Comment | |
|---|---|---|---|---|---|
| current | 15:14, 6 May 2016 | | 439 × 292 (82 KB) | Gap (talk | contribs) | |
| 15:15, 18 April 2024 | No thumbnail | (82 KB) | Gap (talk | contribs) | Fig. 9.3 Results of fluoride monitoring from 20.05.2010 to 28.02.2013 in the Nakuru Technique filter. CP: contact precipitation (“Nakuru Technique”), BC: bone char. At around 800 m3, the concentrations of fluoride and salts in the raw water rises. |
- You cannot overwrite this file.
File usage
The following page links to this file: