File:Figure 9.13.jpg
From GapWiki

Size of this preview: 571 × 600 pixels. Other resolution: 800 × 840 pixels.
Original file (800 × 840 pixels, file size: 113 KB, MIME type: image/jpeg)
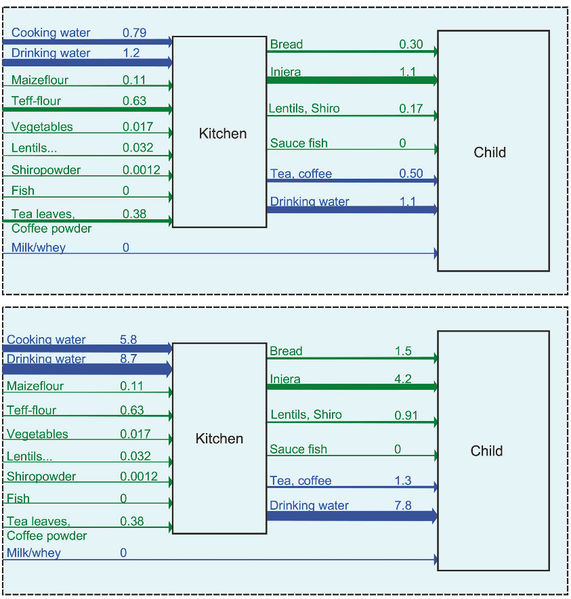
Fig. 9.13 Simplified flow diagrams summarising the flows of fluoride in food and water for Village A (top) and Village B (bottom). The units are mg F per child per day.
File history
Click on a date/time to view the file as it appeared at that time.
| Date/Time | Thumbnail | Dimensions | User | Comment | |
|---|---|---|---|---|---|
| current | 15:46, 6 May 2016 | | 800 × 840 (113 KB) | Gap (talk | contribs) | |
| 08:30, 22 October 2024 | No thumbnail | (329 KB) | Gap (talk | contribs) | Fig. 9.13 Simplified flow diagrams summarising the flows of fluoride in food and water for Village A (top) and Village B (bottom). The units are mg F per child per day. |
- You cannot overwrite this file.
File usage
The following page links to this file: