Difference between revisions of "File:Figure 3.2.jpg"
From GapWiki
(Sketch of dose-response curves for dental and skeletal fluorosis determined by Fewtrell et al. (2006). Superimposed as green dashed lines are the regressions from Bo et al., (2003).) |
(Gap uploaded a new version of "File:Figure 3.2.jpg") |
(No difference)
| |
Latest revision as of 13:38, 6 May 2016
Sketch of dose-response curves for dental and skeletal fluorosis determined by Fewtrell et al. (2006). Superimposed as green dashed lines are the regressions from Bo et al., (2003).
File history
Click on a date/time to view the file as it appeared at that time.
| Date/Time | Thumbnail | Dimensions | User | Comment | |
|---|---|---|---|---|---|
| current | 13:38, 6 May 2016 | 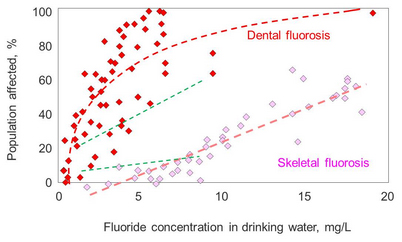 | 402 × 242 (82 KB) | Gap (talk | contribs) | |
| 14:21, 15 November 2026 | No thumbnail | (82 KB) | Gap (talk | contribs) | Sketch of dose-response curves for dental and skeletal fluorosis determined by Fewtrell et al. (2006). Superimposed as green dashed lines are the regressions from Bo et al., (2003). |
- You cannot overwrite this file.
File usage
The following page links to this file:


